
Maidstone's average home lost £256 in the year to July, one of only two Kent districts to fall. Detached fell 0.4% and flats 2.8%, while semis rose.
The average home in Maidstone borough was worth £352,722 in July, £256 less than a year earlier. Only one other Kent district went backwards over the same period.
That is a fall of 0.1%, against a rise of 1.5% across Kent and 1.1% across England. The figures were published by HM Land Registry on 16 September (UK House Price Index reports).
A word on what the number is, because it changes how you read it. The UK House Price Index is built from completed sales registered with the Land Registry, not asking prices, and it is a mean average, not a median. A handful of large sales in a month pull it upward.
Only Dartford did worse
Across Kent’s twelve districts, ten rose and two fell.
| District | Average, July 2026 | Change on year |
|---|---|---|
| Gravesham | £344,923 | +£11,179 (+3.3%) |
| Swale | £298,985 | +£9,321 (+3.2%) |
| Canterbury | £337,454 | +£9,640 (+2.9%) |
| Dover | £277,750 | +£7,363 (+2.7%) |
| Thanet | £269,708 | +£4,701 (+1.8%) |
| Tonbridge and Malling | £407,880 | +£5,607 (+1.4%) |
| Ashford | £347,562 | +£4,674 (+1.4%) |
| Sevenoaks | £538,714 | +£5,566 (+1.0%) |
| Folkestone and Hythe | £303,296 | +£2,671 (+0.9%) |
| Tunbridge Wells | £456,227 | +£2,661 (+0.6%) |
| Maidstone | £352,722 | -£256 (-0.1%) |
| Dartford | £347,773 | -£7,043 (-2.0%) |
The pattern is worth a second look. The districts gaining the most are the cheaper ones: Gravesham, Swale, Canterbury and Dover all sit below the Kent average of £346,904 and all rose by more than 2.5%. The expensive end barely moved, with Tunbridge Wells up 0.6% and Sevenoaks 1.0%.
Maidstone is neither. It sits just above the county average and it fell.
Which homes lost value
The borough total hides four different stories.
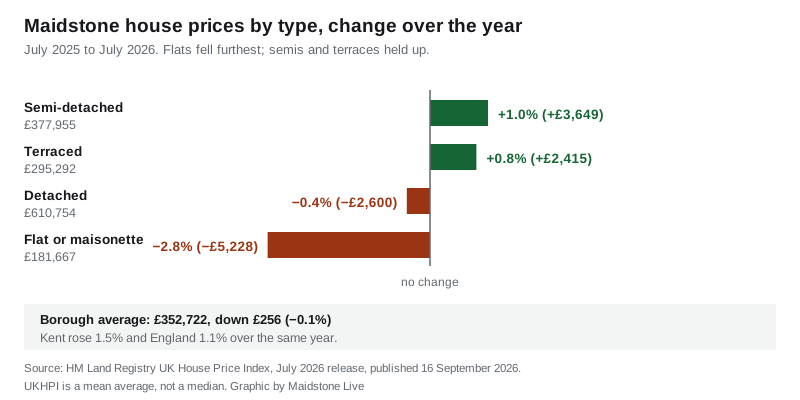
| Property type | July 2026 | Change on year |
|---|---|---|
| Detached | £610,754 | -£2,600 (-0.4%) |
| Semi-detached | £377,955 | +£3,649 (+1.0%) |
| Terraced | £295,292 | +£2,415 (+0.8%) |
| Flat or maisonette | £181,667 | -£5,228 (-2.8%) |
Flats are the clear loser, down 2.8% over the year and now averaging under £182,000. Detached homes slipped slightly. Semis and terraces, the middle of the Maidstone market, both gained about 1%.
That is the same split we reported in June, and it has held for several months.
The first-time buyer figure has not moved
The average price paid by a first-time buyer in Maidstone borough was £292,157 in July. A year earlier it was £292,142.
That is a difference of £15 across twelve months, on a figure approaching £300,000.
For anyone saving, the practical reading is that the target has stopped moving away. It has not come down either.
June has been revised down
When the June 2026 figures came out in August, the borough average was published as £352,191. In this release, June reads £350,943, a downward revision of £1,248.
Revisions are normal. The index is rebuilt each month as more sales complete and register, and early months are the least settled. It is a reason to treat any single month with caution and watch the direction over a year instead.
On the index itself, Maidstone is at 98.5, where January 2023 equals 100. It was also 98.5 in July 2025. Prices in this borough are exactly where they were a year ago, and still below where they were three and a half years ago.
What it means for you
If you are selling a flat, the market has moved against you this year, and by more than any other property type in the borough. If you are selling a semi or a terrace, you are modestly ahead.
A few things worth knowing about these figures:
- They are borough-wide. Bearsted, Marden, Staplehurst and the town centre are not separated out.
- They lag. July’s data is published in September, and each month is revised afterwards.
- They are a mean, so one large sale moves them. A median would sit lower.
- A valuation from an agent is not this number, and neither is a Zoopla estimate.
Our Maidstone house prices page carries the longer picture, including how the borough compares with its neighbours and what the index has done since 2023. If you are budgeting a move within the borough, the council tax bands guide sets out what each band costs this year.
Sources
- HM Land Registry, UK House Price Index: Maidstone, July 2025 to July 2026 (every Maidstone figure above, including the by-type and first-time buyer averages and the revised June figure)
- HM Land Registry, UK House Price Index (Kent, England and the eleven other Kent district figures, same July 2026 release)
- UK House Price Index reports, GOV.UK (confirms the July 2026 data was published on 16 September 2026)
Have your say