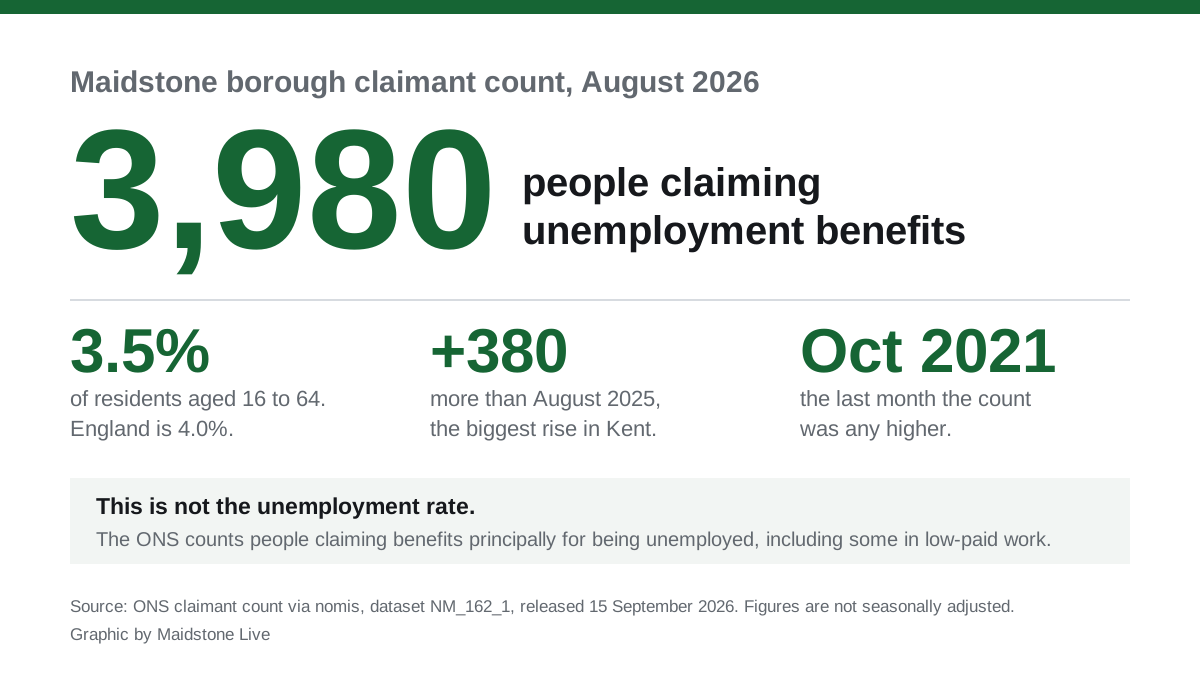

Maidstone's claimant count reached 3,980 in August, the highest since October 2021. The borough added 380 in a year, more than anywhere else in Kent.
The number of people claiming unemployment-related benefits in Maidstone borough reached 3,980 in August. That is the highest monthly figure since October 2021.
The borough has added 380 claimants in a year, a rise of 10.6%. No other Kent district added as many.
The figures come from the ONS claimant count, released through nomis at 7am on 15 September (nomis, claimant count dataset). They cover August 2026.
The number in context
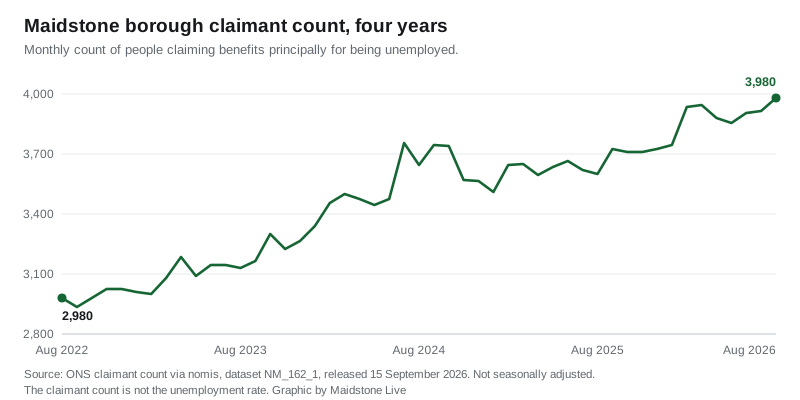
Maidstone’s count has been climbing for four years without anyone announcing it. It stood at 5,445 in March 2021, fell to 2,935 by September 2022, and has risen in most months since.
October 2021 is the last month in which it was higher than it is now, at 4,065. Every month since February 2026 has been above every month of 2025.
As a share of residents aged 16 to 64, the count is now 3.5%. It was 3.1% a year ago.
How Maidstone compares in Kent
Only Thanet has more claimants than Maidstone among Kent’s twelve districts, and Thanet’s rate is far higher. On the rate, three districts are above Maidstone and one is level with it.
| District | Claimants, Aug 2026 | Rate | Change on year |
|---|---|---|---|
| Thanet | 4,455 | 5.4% | +8.5% |
| Maidstone | 3,980 | 3.5% | +10.6% |
| Swale | 3,410 | 3.5% | +3.0% |
| Canterbury | 3,200 | 3.2% | +5.6% |
| Gravesham | 2,960 | 4.3% | +0.7% |
| Dartford | 2,605 | 3.3% | +11.1% |
| Ashford | 2,515 | 2.9% | +2.2% |
| Folkestone and Hythe | 2,450 | 3.8% | +1.4% |
| Dover | 2,300 | 3.3% | 0.0% |
| Tonbridge and Malling | 2,095 | 2.5% | +10.3% |
| Tunbridge Wells | 1,805 | 2.5% | +11.4% |
| Sevenoaks | 1,675 | 2.3% | +9.5% |
Two things stand out. Maidstone’s rise of 380 is the largest in the county in absolute terms, ahead of Thanet’s 350 and Dartford’s 260. And the steepest percentage rises are not in the places with the highest rates: Tunbridge Wells is up 11.4% and Tonbridge and Malling 10.3%, both from a low base, while Dover has not moved at all.
Across Kent the count reached 33,450, a rise of 6.0% on the year. England’s total was 1,486,460, up 1.8%. So Maidstone’s increase is running at roughly six times the national rate of change.
The rate itself still sits below England’s 4.0%, and just above the South East’s 3.1%.
Who the rise is made up of
The dataset splits the count by age. Comparing August 2026 with August 2025:
| Age | Aug 2025 | Aug 2026 | Change |
|---|---|---|---|
| 16 to 24 | 700 | 825 | +125 (+17.9%) |
| 25 to 49 | 2,110 | 2,235 | +125 (+5.9%) |
| 50 and over | 785 | 920 | +135 (+17.2%) |
The rise is concentrated at both ends of working life. Claimants aged under 25 and over 50 are each up by around 17%, while the largest group, those aged 25 to 49, rose by under 6%.
The ONS does not publish a rate for individual age bands, only counts, so there is no way to say what share of Maidstone’s under-25s this represents.
What this number is, and what it is not
This is not the unemployment rate, and reading it as one will mislead you.
The ONS is explicit in its own methodology. The claimant count “is a measure of the number of people claiming benefits principally for the reason of being unemployed, based on administrative data from the benefits system”. It “does not attempt to measure unemployment, which is a concept defined by the International Labour Organisation (ILO) as all those who are out of work, actively seeking work and available to start work” (ONS, Claimant Count QMI).
Two gaps matter locally. People who are out of work but not eligible to claim, including many aged 16 and 17, those in full-time education and those over state pension age, are not counted. Under Universal Credit, some people who are working but on low earnings and required to look for more work are counted.
What the figure is good for is comparison: the same measure, in the same place, month after month, and across neighbouring districts on the same day. That is why the direction of travel here is worth more than the absolute number.
What it means for you
If you are claiming in Maidstone, you are one of 3,980 people, and the local labour market has more competition in it than at any point in nearly five years.
Practical points:
- The next monthly release covers September 2026 and is published by the ONS in October. We will update this page when it lands.
- The figures are borough-wide. They are not broken down to Bearsted, Marden or Staplehurst.
- If a fall in household income is the issue, the council’s benefits and cost of living pages are the first stop, and our council tax bands guide explains which band you are in and what a reduction would be worth.
- Housing costs are the other half of the picture. The borough’s average house price fell slightly over the same year, which we cover in our report on the July house price figures.
Sources
- ONS claimant count, nomis dataset NM_162_1, released 15 September 2026 at 07:00. Maidstone borough figures pulled from the nomis data API (counts and rates, 24-month series)
- Kent district comparison from the same dataset for all Kent districts
- ONS, Claimant Count Quality and Methodology Information (what the measure counts and how it differs from ILO unemployment)
Have your say